

Joy Foroughi
Executive Assistant


Mobile App Analytics Explained: Why Startups should Care in 2026
Discover what mobile app analytics is and why you should care in 2026. Empower your startup with data-driven insights for success!

Mobile app analytics is the systematic practice of collecting and analyzing data about how users interact with your app and how it performs technically, so your team can make evidence-based decisions instead of educated guesses. Done well, it replaces instinct with clarity across three core areas:
Behavior: What users do inside your app, recorded as events like onboarding completion, feature taps, and purchases
Retention: Whether users return after Day 1, Day 7, and Day 30, one of the strongest indicators of long-term product viability
Technical health: Crash rates, load times, and error frequency that quietly destroy retention before any marketing dollar has a chance to work
The shift from guesswork to evidence-based decisions is where analytics pays off most for startups. When you know exactly where users drop off and which features drive repeat sessions, every engineering hour and product decision carries real financial weight.
What is mobile app analytics, and which metrics actually matter?
Mobile app analytics splits into two categories: behavioral analytics and operational analytics. Behavioral analytics tracks user actions, funnels, feature adoption, and cohort retention. Operational analytics monitors crashes, load times, and performance signals that affect the experience before a user ever reaches your core value.
The KPIs worth tracking for most startups:
DAU/MAU ratio (stickiness): Shows how frequently monthly users return on a given day. Since healthy ranges vary significantly by app category, compare this ratio against your historical baseline and relevant competitors.
Day 1/7/30 retention: Measures the percentage of users who return one, seven, and 30 days after installation. Review it by cohort to determine whether product changes improve long-term engagement.
Session length: Shows how long users remain active during each visit, but longer is not always better. Interpret it alongside task completion, engagement, and conversion.
Crash-free session rate: Measures the percentage of sessions completed without a crash. Track changes by app version, operating system, and device to identify regressions quickly.
Conversion rate: Separate install-to-trial from trial-to-paid, because each weak number points to a different problem
Lifetime value (LTV) and ARPU: The revenue metrics that connect engagement to business outcomes
Mobile analytics also differs from web analytics in ways that matter operationally. Apps use screen views instead of page views, track offline interactions with timestamps that sync on reconnect, and operate under app-store privacy rules that have no web equivalent.
Pro Tip: Assign a named owner to each metric. Analytics without ownership becomes a dashboard nobody acts on. When Day 7 retention drops, someone specific should be responsible for diagnosing the funnel step upstream.

Avoid tracking everything. A focused set of decision-relevant metrics consistently outperforms cluttered dashboards full of vanity numbers. Start with 10–20 events tied directly to your business goals, then expand only when you have a specific question to answer.
How US privacy regulations shape what you can track
Privacy compliance is not optional, and in 2026 it directly shapes which metrics you can collect and how reliable your data will be.
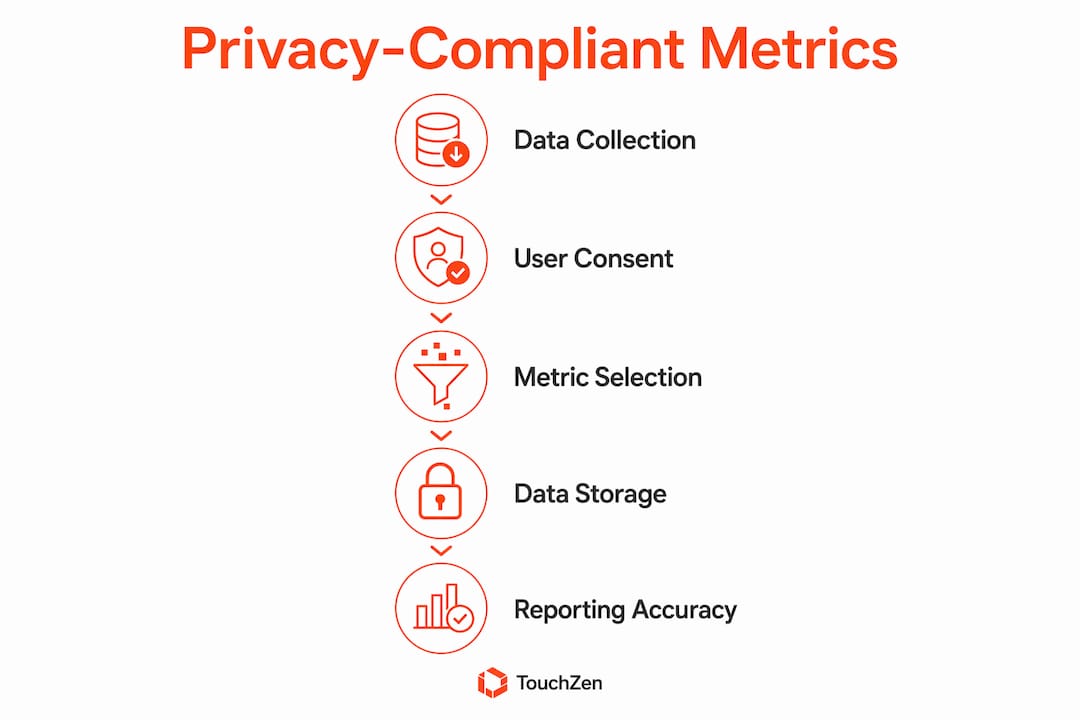
Apple's App Tracking Transparency (ATT) requires explicit user permission before your app can link data across other companies' apps for advertising or measurement. On Android, Google retired its Privacy Sandbox Attribution Reporting API in October 2025 due to low adoption, so Android ad measurement currently still relies on identifier-based approaches while the industry works toward new privacy-preserving standards.
Practical steps for building a compliant analytics environment:
Obtain ATT consent at a moment when users understand the value exchange, not at cold launch
For GDPR, document your lawful basis for processing. For CCPA/CPRA, provide the required notices and honor applicable opt-out preference signals, including Global Privacy Control.
Never log personally identifiable information (PII) such as email addresses or precise location in event parameters
Use session-based, aggregated insights rather than persistent user identifiers wherever possible
Set data retention policies and automate deletion to minimize your data surface
The payoff of privacy-first analytics goes beyond compliance. When you only collect what you need, your data is cleaner, your auditing is simpler, and your users trust you more.
How to turn analytics data into product decisions that lift engagement
Analytics is a feedback loop, not a passive dashboard. The teams that grow fastest treat every metric movement as a clue pointing toward a specific product problem, then act on it within the same sprint cycle.
Funnel and cohort analysis are your primary diagnostic tools. When Day 7 retention falls, move one step upstream in the funnel and look at onboarding friction and time to first value. When purchase conversion drops, examine the paywall or checkout steps immediately before the event. Segment funnels by user type, app version, and time period to isolate the friction point.
A/B testing closes the loop between hypothesis and evidence. Product intuition becomes less reliable as apps scale, and A/B testing reduces bias by objectively measuring feature impact on real user behavior. Validate a hypothesis with analytics data first, run the experiment, then measure whether the intended metric moved before scaling the change.
Merging quantitative data with qualitative feedback is where the "why" becomes clear. A 20% drop-off at checkout tells you there is a problem. Support tickets and user reviews tell you what users are actually experiencing at that step. Mapping bugs and friction points to revenue impact transforms your roadmap from a wish list into a financial plan.
Pro Tip: Integrate analytics review into your weekly sprint cadence. Teams that check their app user retention data on a fixed schedule catch trend shifts early enough to act before they compound into churn.
Which analytics tools should you consider?
The right tool stack depends on your team's goals, but most startups need coverage across four functional areas:
Function | What it covers |
|---|---|
In-app behavior | Events, funnels, cohorts, retention curves |
Attribution | Connecting installs and post-install events to traffic sources |
Crash and performance | Crashes, ANRs, slow screens, error rates |
App store analytics | Ratings, reviews, keyword rankings, store conversion |
Firebase Analytics and Mixpanel are two of the most widely used tools for in-app behavior tracking, and comparing them on retention metrics is a useful starting point for choosing your stack. For attribution, AppsFlyer and Adjust are the category leaders. Firebase Crashlytics and Sentry handle crash monitoring. For broader startup tool context, a current roundup of AI tools for founders covers how analytics platforms fit into the wider product stack.
A clear dashboard with 6–10 primary KPIs is more useful than a large report nobody checks.
What are the real challenges of mobile app analytics?
The most common failure mode is not a bad tool. It is bad discipline. Teams instrument too many events, fill dashboards with numbers that never drive a decision, and then lose confidence in the data entirely.
Three challenges worth planning for:
Data quality: Inconsistent event naming breaks funnels and corrupts reports. A clean naming convention ("purchase_completed" not "Purchase_Complete" in one place and "buy_done" in another) is foundational.
Privacy constraints: ATT opt-out rates reduce the volume of user-level data available on iOS, which means aggregated, session-based insights become more important, not less.
Cross-version fragmentation: Frequent app updates mean users spread across versions with different experiences. Cohort analysis by app version is the only reliable way to measure the effect of a specific release.
Data volume is also a real operational challenge. Storing and handling event data at scale requires a plan for archiving, exporting, and eventually deleting records in line with your retention policy.
How to integrate analytics into your development lifecycle
Analytics works best when it is built into the process from day one, not bolted on after launch.
Before you build: Define the two or three business questions your team needs to answer this quarter, then work backward to the events that answer them
During development: Instrument events as features are built, not after, so you ship with measurement already in place
At launch: Establish baseline metrics for retention, activation, and crash-free sessions so you have a reference point for every future release
Post-launch: Use cohort analysis to measure whether each update moved the intended metric, and close the learning loop before committing to the next feature
Ongoing: Assign metric owners, set a weekly review cadence, and connect every significant metric movement to a product or engineering response
For mobile app onboarding specifically, instrument the full first-run flow before launch. Day 1 retention problems almost always trace back to onboarding friction, and you cannot diagnose what you did not measure.
TouchZen builds apps where analytics is part of the foundation
Startups that ship without analytics instrumentation spend months recovering data they should have had from day one. TouchZen's approach is different: senior developers and designers work directly with your team from kickoff through launch, with analytics architecture built into the product from the start, not added as an afterthought.
With over 75 apps launched across industries, including results like a 10x increase in user subscriptions and 100,000 downloads within the first year, TouchZen connects data insights to the product decisions that actually move growth metrics. Post-launch support means your app continues to evolve as user behavior data accumulates. If you are ready to build an app where every feature decision is grounded in real user data, TouchZen's mobile app development team is the partner to do it with.
Key Takeaways
Mobile app analytics drives sustainable app growth when every tracked metric connects directly to a product decision and has a named owner who acts on it.
Point | Details |
|---|---|
Two types of analytics | Behavioral analytics tracks user actions and retention; operational analytics monitors crashes and performance. |
Retention tracking | Retention rates typically decline over time, with a notable drop from Day 1 to Day 30 across app categories. |
Privacy compliance | ATT on iOS and CCPA/GDPR require consent-first instrumentation and data minimization from the start. |
Analytics as a feedback loop | Assign metric owners and review data weekly so insights translate into sprint-level product decisions. |
TouchZen's approach | TouchZen integrates analytics architecture from kickoff, with senior developers delivering over 75 launched apps and measurable growth results. |
FAQ
What is mobile app analytics?
Mobile app analytics is the process of collecting and analyzing data about user behavior, engagement, retention, conversions, and technical performance. It helps teams understand how people use an app and where the experience needs improvement.
Why is mobile app analytics important for startups?
Analytics helps startups make product decisions based on evidence instead of assumptions. It reveals where users abandon important flows, which features encourage repeat usage, and which technical issues may be affecting retention or revenue.
Which mobile app analytics metrics should startups track?
Most startups should begin with activation rate, Day 1, Day 7, and Day 30 retention, feature adoption, conversion rate, crash-free sessions, lifetime value, and average revenue per user. The exact metrics should reflect the app’s business model and current product goals.
What are the best mobile app analytics tools for startups?
Firebase Analytics and Mixpanel are common choices for behavior and retention analysis. Firebase Crashlytics and Sentry help monitor technical performance, while AppsFlyer and Adjust support attribution. The best combination depends on your budget, growth stage, and reporting requirements.
Does mobile app analytics require user consent?
Not every form of first-party analytics requires Apple’s ATT permission. ATT applies when data is used to track users across apps or websites owned by other companies. However, privacy laws and platform policies may create additional notice, consent, and opt-out requirements, so the implementation should be reviewed for each market.


