
Joy Foroughi
Executive Assistant


Mobile App Revenue: A Founder's ROI Calculator Guide
Uncover potential earnings with "How Much Revenue Can a Mobile App Make A Founder’s ROI Calculator." Prepare smartly before coding!

TL;DR:
App revenue varies widely across categories and business models, so a structured ROI model helps founders evaluate realistic profitability before investing.
App revenue varies widely across categories, platforms, and business models. That's exactly why founders need a structured ROI model before writing a single line of code. Large market-level revenue figures do not tell you whether an individual product will be profitable. Your job is to determine, before you invest, whether your app's acquisition, retention, conversion, and monetization assumptions can support a sustainable business.
The core ROI formula is straightforward:
ROI (%) = (Net Profit / Total Investment) × 100
For a mobile app, net profit means revenue after platform fees, user acquisition, infrastructure, maintenance, and other operating costs. Taxes should be modeled separately based on taxable profit and the company’s jurisdiction.
To run a quick mental calculation right now, you need five inputs:
Downloads or Monthly Active Users (MAU): Your expected install volume and how many users stay active.
Conversion to payer: The share of active users who pay, whether through a subscription, in-app purchase (IAP), or paid download. Statista's app conversion rate data shows this varies sharply by category and platform.
ARPU / ARPDAU: Average Revenue Per User (monthly or daily), which determines your revenue ceiling per cohort.
CAC (Customer Acquisition Cost): What you spend to acquire each paying user, including creative, media, and attribution costs.
Total investment: Development, design, QA, launch marketing, and ongoing operating expenses.
These five numbers, run through the formula above, tell you whether your app has a viable path to positive ROI or whether the model needs reworking before you spend a dollar on development.
How to run your app's ROI calculation step by step
A founder's ROI calculator for mobile apps is not a single spreadsheet cell. It's a sequential model that converts installs into revenue, subtracts every real cost, and outputs payback months and return percentage. Here's how to build and run it.
Step 1: Define your inputs
Input | Definition | Example Value |
|---|---|---|
Initial development cost | Total spend to build and launch the MVP | $80,000 |
Monthly OPEX | Hosting, analytics, third-party APIs, support | $3,000/mo |
CPI / CAC | Cost per install or cost per paying user | $2.50 CPI / $25 CAC |
Monthly installs | Paid + organic new installs per month | 5,000 |
Active user rate | Share of installs who become MAU | 40% |
Payer conversion | Share of MAU who pay | 5% |
ARPU (monthly) | Average monthly revenue per paying user | $12 |
Store fee | Apple App Store or Google Play commission | standard rates vary but can be substantial |
Effective tax rate | Federal + state on net income | 25% |
Step 2: Calculate monthly gross revenue
Monthly payers = Installs × Active rate × Payer conversion
= 5,000 × 0.40 × 0.05 = 100 payers
Gross MRR = Payers × ARPU = 100 × $12 = $1,200
Step 3: Subtract platform fees
Net revenue after platform fees = Gross revenue × (1 – applicable platform fee)
Using a hypothetical 30% fee for illustration:
$1,200 × (1 – 0.30) = $840/month
Platform fees vary by storefront, program, transaction type, and billing method, so replace this example rate with the one that applies to your app.
Step 4: Subtract operating and acquisition costs
Monthly operating profit before tax = Net revenue after platform fees – Monthly OPEX – User acquisition spend
Before user acquisition costs, the example produces:
$840 – $3,000 = –$2,160/month
Because the result is already negative before adding acquisition spend, the app is not profitable at this scale. Any paid user acquisition would increase the monthly loss.
Step 5: Treat taxes separately
Taxes vary by company structure and jurisdiction and should not simply be deducted from store proceeds. For planning purposes, calculate operating profit first, then estimate applicable taxes on positive taxable profit. In this example, the app is already operating at a loss, so no flat tax deduction is applied.
Step 6: Calculate payback and ROI
If monthly operating profit is positive and relatively stable:
Payback months = Initial development cost ÷ Monthly operating profit
For a changing business, use cumulative monthly cash flow instead.
Because this example is losing money even before user acquisition costs, it does not reach payback under the current assumptions. The founder would need to improve conversion, ARPU, retention, acquisition efficiency, or operating costs before scaling.
Pro Tip: Set your base-case assumptions at the 25th percentile of published benchmarks, not the median. Most founders anchor on median figures and then underperform them. Starting conservative means a positive ROI surprise rather than a funding crisis.
You can model channel-by-channel scenarios using tools like the Mobile App ROI Calculator & Budget Planner from TheAICMO, which let you compare TikTok, Google UAC, and Apple Search Ads (ASA) side by side with separate LTV and payback outputs per channel.
What the revenue distribution actually looks like for most apps
The honest answer to “how much can my app make?” is that there is no universal revenue benchmark that predicts an individual app's outcome. Revenue varies significantly by category, platform, audience, retention, pricing, and acquisition strategy. Instead of relying on a general monthly revenue tier, founders should benchmark their specific category and replace those assumptions with real retention, conversion, and revenue data as soon as the app launches.
The 2025 mobile app market analysis shows a telling pattern: download volumes have softened, but consumer spending per app has risen. Fewer apps are getting installed, but the ones that earn trust are extracting more revenue per user. That's a signal to prioritize depth over breadth in your monetization model.
iOS consistently monetizes at over twice the ARPU of Android in many consumer categories, according to Statista's mobile app monetization data. If you're building a subscription app and have to choose a platform for your MVP, that gap matters for your early ROI model.
Practical takeaways for founders deciding whether to proceed:
If your category benchmark ARPU is under $3/month and your CAC is above $5, the math likely doesn't work without massive scale.
Apps in health, finance, and B2B productivity consistently outperform entertainment apps on ARPU, even with lower download volumes.
Organic discovery (App Store Optimization, word-of-mouth, content) is the only path to positive ROI for apps with low ARPU. Paid UA at scale requires ARPU above your blended CAC within 6–12 months.
Platform matters: launching iOS-first is the standard recommendation for subscription and IAP-heavy products targeting US consumers.
Which monetization model fits your app and what revenue to expect
Choosing the wrong monetization model is one of the most common reasons a technically solid app fails to generate meaningful revenue. Each model has a distinct unit economics profile, and the right choice depends on your user behavior, category, and willingness to invest in retention.
Subscriptions
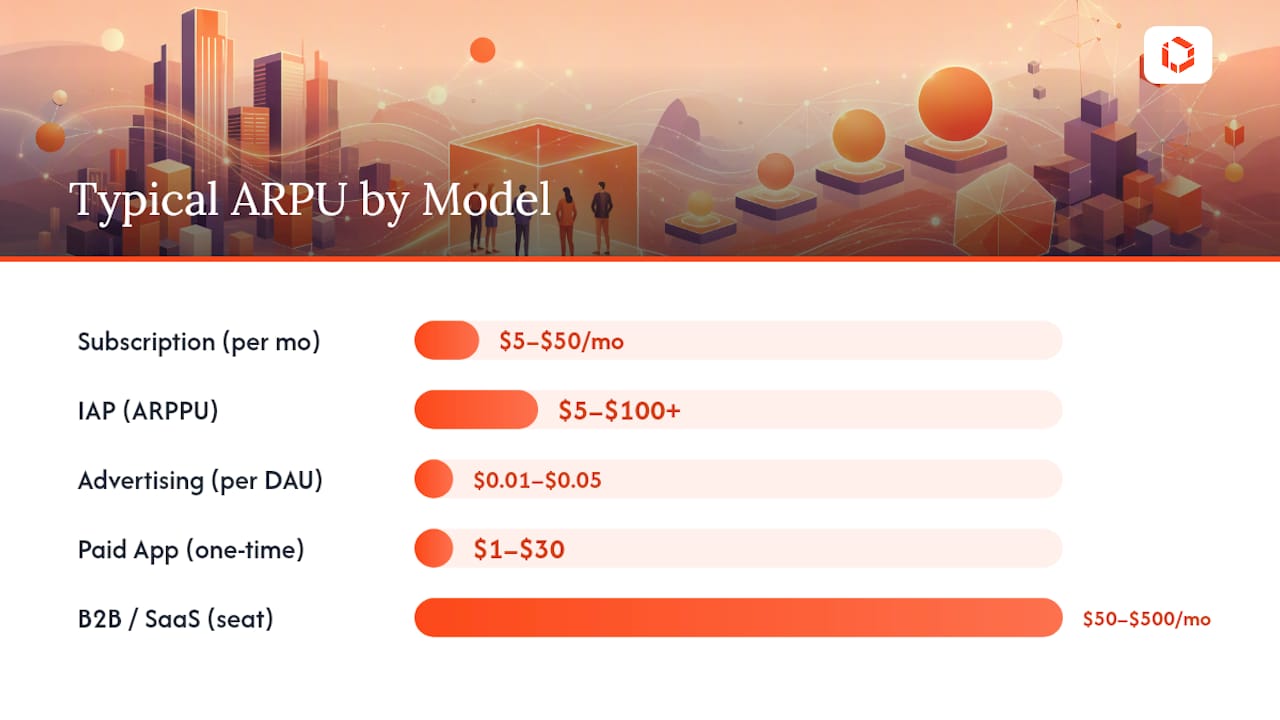
Subscriptions generate recurring monthly or annual revenue per paying user. ARPU for consumer subscription apps typically ranges from $5–$15/month for utility and productivity apps, and $15–$50/month for health, fitness, and professional tools. Annual plans improve LTV significantly because they reduce monthly churn. The critical metric is trial-to-paid conversion: most subscription apps convert 20–40% of free trial users to paid, though this varies sharply by onboarding quality and paywall design.
Subscription churn is the silent killer. A monthly churn rate of 5% means you lose more than half your subscriber base in a year. Tactics for reducing cancellations are covered in depth in this guide on subscription churn reduction.
In-App Purchases (IAP)
IAP works best in gaming, social, and entertainment apps where users buy virtual goods, power-ups, or premium content. Payer conversion rates are typically lower than subscriptions (often 2–5% of MAU), but high spenders ("whales") can generate disproportionate revenue. Average Revenue Per Paying User (ARPPU) for IAP-heavy games can reach $30–$100+ per month from the top 5% of payers.
Advertising
Ad monetization suits high-DAU, low-ARPU apps: casual games, news readers, and social utilities. Revenue is modeled as impressions per DAU × fill rate × eCPM. US eCPMs for rewarded video typically range from $10–$30; banner ads run $0.50–$2.00. At 1,000 DAU with 3 impressions per user and a $15 eCPM, you're generating roughly $45/day, or about $1,350/month. Scaling this to meaningful revenue requires hundreds of thousands of DAU.
Paid Apps
Paid downloads have declined sharply as a primary model. Average paid app prices on the Apple App Store sit in the $1–$5 range for consumer apps, with professional tools reaching $10–$30. The model works for niche professional tools with strong word-of-mouth but rarely for consumer entertainment. One-time revenue with no recurring component makes LTV modeling simple but limits upside.
B2B / SaaS Mobile
B2B mobile products command the highest ARPU of any category, often $50–$500+ per seat per month. Deal sizes are larger, sales cycles are longer, and churn is lower. The ROI model looks fundamentally different: fewer users, much higher revenue per user, and acquisition driven by outbound sales or product-led growth rather than paid UA.
Model | Typical ARPU | Payer Conversion | Best For |
|---|---|---|---|
Subscription | $5–$50/mo | 20–40% of trial users | Productivity, health, finance |
IAP | $5–$100+ ARPPU | 2–5% of MAU | Gaming, social, entertainment |
Advertising | $0.01–$0.05/DAU | N/A (all users) | High-DAU, casual, news |
Paid App | $1–$30 one-time | 100% of downloads | Niche professional tools |
B2B / SaaS | $50–$500/seat/mo | Pipeline-driven | Enterprise, field, vertical SaaS |
For a deeper look at choosing and testing your model, the app monetization strategy planning guide covers paywall experimentation and pricing test frameworks in detail.
Every cost you need to include and realistic timelines to break-even
Founders routinely undercount costs. The development invoice is visible; the ongoing burn is not. A complete ROI model accounts for every dollar out the door, not just the build.
Cost breakdown
Cost Category | One-Time (MVP) | Monthly OPEX |
|---|---|---|
Development (US-based agency) | $80,000–$250,000 | — |
Development (offshore / nearshore) | $25,000–$80,000 | — |
UX/UI design | $15,000–$40,000 | — |
QA and testing | $5,000–$15,000 | — |
App Store submission & setup | $500–$2,000 | — |
Cloud infrastructure (AWS, GCP) | — | $500–$5,000 |
Analytics (Mixpanel, Amplitude) | — | $200–$2,000 |
Third-party APIs / SDKs | — | $100–$1,500 |
Customer support tooling | — | $200–$800 |
UA / paid acquisition budget | — | $2,000–$50,000+ |
Maintenance & feature updates | — | $3,000–$15,000 |
Legal (privacy policy, ToS, IP) | $2,000–$8,000 | — |
For a detailed breakdown of what to budget after launch, the mobile app maintenance costs guide covers how ongoing costs evolve as your user base grows.
CAC, LTV, payback months, and the unit economics that determine viability
Unit economics are the foundation of every viable app business. Get these wrong in your model and no amount of growth will save you.
Worked example: 1,000 installs
Installs: 1,000 at $2.50 CPI = $2,500 UA spend
Active users (40%): 400
Payers (5%): 20
CAC: $2,500 ÷ 20 = $125 per paying user
ARPU: $12/month
Store fee (30%): $3.60 → Proceeds: $8.40/month per payer
Monthly contribution per payer: $8.40
Payback: $125 ÷ $8.40 = ~15 months
That's a marginal business at this scale. At 10% payer conversion, CAC drops to $62.50 and payback falls to 7.4 months. Conversion is the lever.
Three founder scenarios run through the calculator
Scenario 1: Indie hobby app (ad-monetized)
Inputs:
Development cost: $15,000 (solo developer, offshore)
Monthly OPEX: $500
UA budget: $0 (organic only)
Monthly installs: 1,000 (organic)
DAU: 300
Ad eCPM: $12 (US rewarded video)
Impressions per DAU: 2
Outputs:
Outputs:
Daily ad revenue: 300 × 2 × ($12/1,000) = $7.20/day
Monthly gross revenue: ~$216
Monthly OPEX: $500
Monthly operating result before tax: $216 – $500 = –$284/month
Taxes: Not modeled because the example is already operating at a loss
Payback: None at the current scale
Scenario 2: Mid-market subscription consumer app
Inputs:
Development cost: $120,000
Monthly OPEX: $4,000
CPI: $2.50, monthly installs: 8,000
Active rate: 45%, payer conversion: 7%
ARPU: $14/month, store fee: 30%, tax: 25%
Outputs:
Outputs:
Monthly active users: 8,000 × 45% = 3,600
New payers from the monthly cohort: 3,600 × 7% = 252
Gross MRR from the cohort: 252 × $14 = $3,528
Proceeds after an illustrative 30% platform fee: $2,469.60
UA spend if all 8,000 installs are paid: 8,000 × $2.50 = $20,000
Monthly operating result before tax: $2,469.60 – $4,000 – $20,000 = –$21,530.40
Taxes: Not modeled because the example is operating at a loss
At these assumptions, the model does not break even. The founder would need to improve acquisition efficiency, payer conversion, retained subscriber revenue, or operating costs before scaling paid acquisition.
Scenario 3: B2B SaaS mobile product
Inputs:
Development cost: $180,000
Monthly OPEX: $6,000
CAC (sales-driven): $800 per paying account
Monthly new accounts: 10
ARPU: $200/seat/month, avg 3 seats per account = $600/account
Store fee: 0% (invoiced directly), tax: 25%
Outputs:
Monthly gross: 10 × $600 = $6,000 (new MRR from new accounts only)
Cumulative MRR at month 6 (assuming 2% monthly churn): ~$33,600
After tax: ~$25,200
Monthly UA cost: 10 × $800 = $8,000
Net at month 6: $25,200 – $6,000 – $8,000 = +$11,200/month
Payback on development: ~$180,000 ÷ $11,200 = ~16 months
B2B is the most forgiving model for ROI because high ARPU and low churn compound quickly. The industry-specific app development guide covers how vertical focus affects both ARPU and acquisition cost in B2B mobile.
TouchZen has worked with founders across all three of these scenarios. In one case, a subscription app client reached 100,000 downloads within the first year and achieved a 10x increase in user subscriptions after a monetization redesign and phased UA ramp, demonstrating how structured agency support can compress the payback timeline.
Practical levers to improve your app's ROI
Once your model is built, the question becomes: which variables can you actually move, and in what order?
Product and onboarding
Redesign your onboarding to reach the "aha moment" within the first session. Apps that deliver value in the first 3 minutes see materially higher D1 retention.
Test your paywall placement. Showing the paywall after the user has experienced core value converts at 2–4× the rate of a cold paywall on first open.
Invest in UX/UI design for your paywall screen specifically. Friction at the payment step is the most expensive conversion leak in any subscription app.
Pricing and trials
Offer a 7-day free trial rather than a freemium tier if your core value is demonstrable quickly. Freemium delays the conversion moment and inflates your MAU without improving revenue.
Test annual plan pricing with a 30–40% discount versus monthly. Annual subscribers churn at a fraction of the rate of monthly subscribers.
Use local pricing where the App Store supports it. US-priced subscriptions in lower-income markets convert at near-zero; local pricing can unlock meaningful revenue from those cohorts.
Acquisition and channel mix
Model each UA channel separately. Blending TikTok, Google UAC, and ASA into a single ROAS figure hides which channels are profitable and which are burning cash. Channel-level modeling, as supported by tools like the TheAICMO ROI calculator, is the standard for any serious UA operation.
Web-to-app funnels can reduce platform-fee exposure in some markets and give teams more flexibility to test pricing and checkout flows. Rules and fees vary by platform, storefront, and billing method, so model the terms that apply specifically to your app.
ASO is the highest-ROI acquisition channel for most early-stage apps. A well-optimized App Store listing can reduce effective CPI by 30–50% compared to paid-only acquisition.
Payment routing and fee engineering
External and web-based payment options can change platform-fee exposure in some markets, but there is no universal fee reduction that applies to every app. Apple and Google use different rules based on storefront, program eligibility, transaction type, and billing method. Founders should treat platform fees as a variable in their ROI model and use the current terms that apply to their specific app.
Pro Tip: Before scaling UA, calculate your blended proceeds per paying user after store fees and taxes. Many founders optimize for gross MRR and are surprised by how little reaches their bank account. Knowing your net proceeds per payer is the only number that matters for payback modeling.
Measurement and validation
Track cohort-level LTV from day one, not aggregate revenue. Aggregate revenue hides the fact that your best cohorts may be subsidizing your worst acquisition channels.
Use Apple’s AdAttributionKit for privacy-preserving iOS attribution and campaign measurement.
Set a 90-day review gate: if your D30 retention and payer conversion haven't hit your base-case assumptions by day 90, rework the model before increasing UA spend.
For subscription-specific marketing KPIs and tracking frameworks, the marketing metrics resources at Marketing Guardians offer practical guidance on the metrics that matter most for subscription growth.
Key Takeaways
Most mobile apps earn under $1,000 per month, but founders who model CAC, payer conversion, ARPU, and store fees before building can identify viable paths to positive ROI and avoid the most common capital-destroying mistakes.
Point | Details |
|---|---|
Five inputs determine ROI | Downloads/MAU, payer conversion, ARPU, CAC, and total investment are the variables that control your outcome. |
iOS outperforms Android on ARPU | iOS users generate 2–3× the ARPU of Android users in most consumer categories, making platform choice a financial decision. |
Payback threshold matters | Target payback under 12 months for UA-driven growth and an LTV:CAC ratio above 3:1 for sustainable scaling. |
TouchZen accelerates payback | TouchZen's senior-led development and monetization support has helped clients reach 100k downloads and 10x subscription growth within the first year. |
The ROI question most founders are asking the wrong way
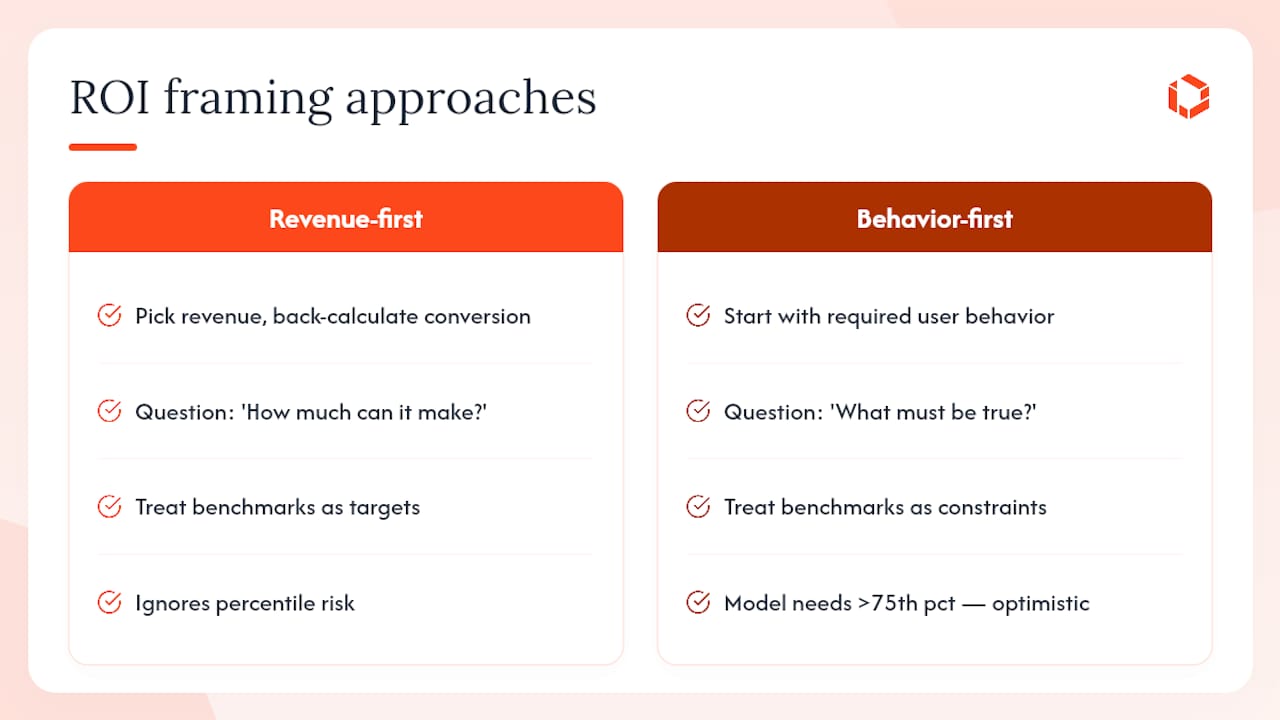
There's a pattern worth naming directly. Most founders approach app ROI the way they'd approach a lottery ticket: they pick a revenue number they want to hit, reverse-engineer a conversion rate that makes it work, and call it a model. That's not forecasting. That's wishful math dressed up in a spreadsheet.
The more useful question isn't "how much can my app make?" It's "what does my app need to be true about user behavior to justify this investment?" Those are different questions, and the second one is harder to answer, which is exactly why most founders avoid it.
The benchmarks in this article, drawn from Sensor Tower, RevenueCat, and Statista, are not targets. They're constraints. They tell you the range of outcomes that real apps in real categories have produced under real market conditions. If your model requires a payer conversion rate that sits above the 75th percentile for your category, you don't have a conservative forecast. You have an optimistic one, and you should price your risk accordingly.
The founders who build profitable apps are not the ones with the best ideas. They're the ones who ran the model honestly, found the scenario where the math worked, and then built the product that fits that scenario rather than the product they originally imagined. That discipline, applied before a dollar is spent on development, is worth more than any feature on your roadmap.
TouchZen builds apps designed to hit your ROI targets, not just ship on time
Knowing your ROI model is one thing. Building the product that actually executes it is another. TouchZen works with startup founders from the earliest stage of discovery through launch and beyond, with a senior team that stays directly involved at every step. No handoffs to junior developers mid-project, no scope creep surprises, and no monetization strategy bolted on after the fact.
The team has launched over 75 apps across industries, with results that include 100,000 downloads in the first year and 10x subscription growth for clients who committed to a structured monetization and UA plan from day one. That track record comes from treating ROI as a design constraint, not an afterthought. When you engage TouchZen, you bring your revenue targets and your calculator assumptions. The team brings the architecture, the paywall design, the MVP scope, and the go-to-market plan that gives those assumptions the best chance of holding up in the real world.
If you're ready to model your app's revenue potential with a team that has built this path before, book a consultation with TouchZen's app experts or review the full scope of TouchZen's mobile app development services to see where your project fits.
Sourced benchmarks, tools, and further reading
The inputs in this article draw from the following sources. Use them to validate your own assumptions or run alternative scenarios.
How much does an app make: Adapty's ultimate app revenue & VAT guide
App Revenue Calculator | Estimate Your Mobile App's Earning Potential
Tool / Source | Best For | Data Type |
|---|---|---|
Statista app monetization | ARPU, eCPM, subscription trends | Aggregated market data |
RevenueCat (via NotJust.dev) | Per-download revenue by category | Subscription benchmark data |
Sensor Tower | Download volumes, category rankings | Store intelligence |
TheAICMO ROI Calculator | Channel-level payback modeling | Interactive scenario tool |
Adapty | Proceeds after fees and taxes | Revenue net-of-cost analysis |
When benchmarks from different sources conflict, prefer cohort-based internal data from your own app over any published figure. Published benchmarks represent averages across thousands of apps; your specific category, audience, and onboarding quality will produce a different result. Use external benchmarks to set your starting assumptions, then replace them with real data as quickly as possible.

FAQ
How much revenue can an app generate per month?
App revenue varies widely based on category, platform, retention, monetization model, payer conversion, and user acquisition. Instead of relying on a universal monthly revenue figure, founders should model these variables using benchmarks from their specific category and then replace those assumptions with real user data after launch.
How much does an app with 10,000 downloads make?
At a 5% payer conversion rate and $12 monthly ARPU, 10,000 downloads might yield 400–500 paying users (accounting for active user drop-off). Actual proceeds after store fees and taxes vary depending on fees and tax rates.
How much is an app with 100,000 users worth?
Valuation depends on revenue, retention, and growth rate rather than raw user count. A subscription app with 100,000 MAU, 5% payer conversion, and $12 ARPU generates substantial gross MRR. Valuation multiples vary widely based on market conditions and company specifics.
How much can an app with 1 million downloads make?
With 1 million downloads, a consumer subscription app at 3% payer conversion and $10 ARPU could generate significant gross MRR and ARR, though actual net proceeds after fees and taxes vary. Ad-monetized apps at the same download volume with substantial DAU and eCPM can generate meaningful ad revenue, but scaling revenue requires hundreds of thousands of DAU.
When should a founder hire an agency instead of building in-house?
Hire an agency when speed to market, monetization expertise, and senior execution matter more than cost minimization. In-house teams make sense when you have a technical co-founder, a long runway, and time to iterate. An agency like TouchZen compresses the timeline from idea to revenue-generating product, which directly shortens payback months in your ROI model.