
Joy Foroughi
Executive Assistant


Why Is My App So Slow? Common Performance Problems Fixed
Discover why your app is slow. Explore common mobile app performance problems and find effective fixes to enhance user experience. Get insights now!

TL;DR:
Mobile app slowness results from distinct issues in startup, main thread use, network calls, and rendering, each requiring targeted fixes. Prioritize diagnosing and fixing these areas based on their impact on user experience, such as startup time and frame rates, rather than broad refactors. Proper performance monitoring and optimized architectural decisions help ensure consistent app responsiveness after launch.
Mobile app slowness is defined by four distinct technical failures: slow startup sequences, main thread blocking, inefficient network calls, and rendering bottlenecks. Each one degrades user experience in a different way, and treating them as a single problem is why most performance fixes fall short. If you're asking why your app is slow, the answer almost certainly lives in one or more of these areas. This guide breaks down each cause by app lifecycle phase, gives you the benchmarks to measure against, and tells you exactly what to fix first.
Why is my app so slow? Common mobile app performance problems explained
App slowness is rarely caused by hardware limits. Architectural decisions and patched code create hidden inefficiencies that compound over time. A single slow function rarely kills an app. The real damage comes from five overlapping problem categories: launch delays, interaction lag, rendering jank, data loading stalls, and background task interference.
Segmenting slowness by lifecycle phase is the most effective diagnostic framework available. Each phase has different causes and different fixes. Trying to solve all of them with one broad refactor wastes time and often introduces new bugs. You need to identify which phase is failing before writing a single line of fix code.
The industry benchmarks are clear. A cold start under 2 seconds signals good performance. Anything beyond that registers as sluggish to users and can affect app store rankings. The 60 FPS rendering standard gives you a 14ms budget per frame. Break that budget on the main thread and users feel it immediately as dropped frames and stuttering animations.
What causes slow app startup and how do you fix it?
Cold, warm, and hot starts each represent a different level of app initialization work. Cold start benchmarks set the target at under 2 seconds, warm starts at under 2 seconds, and hot starts at under 1.5 seconds. Exceeding these thresholds causes visible degradation that users notice and report.
The three biggest startup bottlenecks
The most common startup killers are:
Heavy synchronous work in Application.onCreate(): SDK initialization, disk I/O, and network calls during startup block the main thread and delay the first frame.
Third-party SDK initialization: Analytics tools, crash reporters, and ad SDKs all want to initialize at launch. Running them all synchronously add hundreds of milliseconds.
Large view inflation: Inflating complex layouts before the first screen renders adds measurable delay that users experience as a blank or frozen screen.
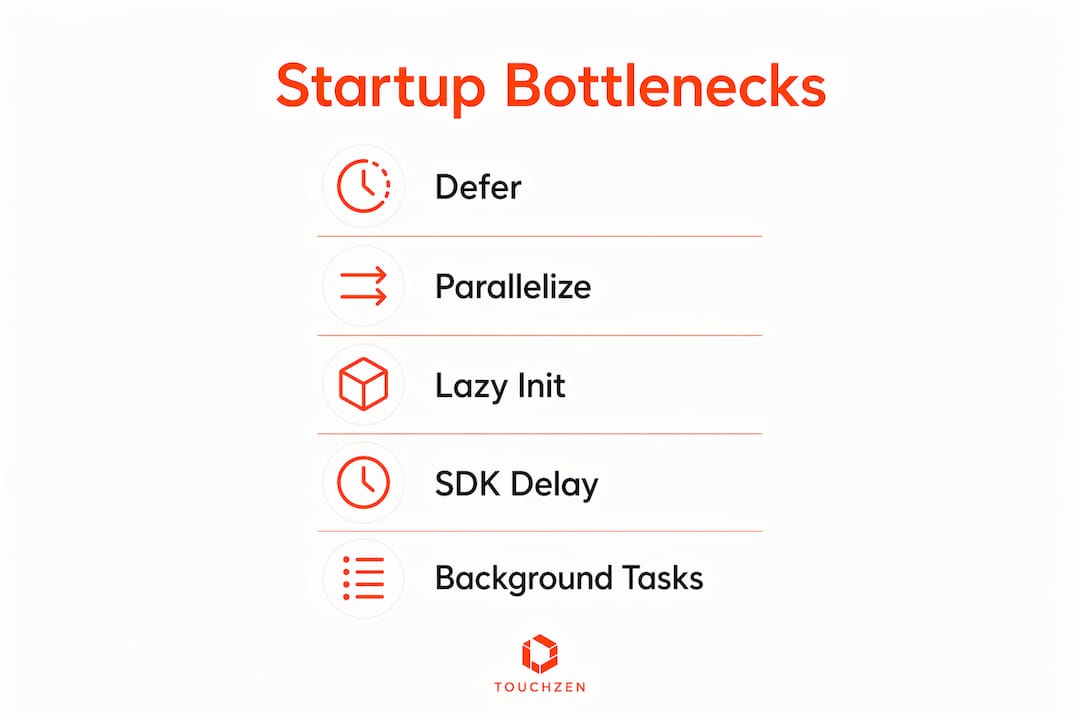
The fix for all three follows the same principle: defer what you can and parallelize what you must.
Pro Tip: Use lazy initialization for non-essential services. Defer analytics SDK and crash reporter setup until after the first frame renders. Users never notice the difference, but your cold start time drops significantly.
Startup type | Target time | Common cause of failure |
|---|---|---|
Cold start | Under 2 seconds | Heavy Application.onCreate() work |
Warm start | Under 2 seconds | Retained process with stale state |
Hot start | Under 1.5 seconds | Expensive onResume() callbacks |
Measure cold start regressions across every release. A startup that takes 1.8 seconds in version 1.0 can quietly creep to 3.2 seconds by version 1.5 as new SDKs and features accumulate. Set a performance budget and enforce it in your CI pipeline.
How does main thread blocking cause lag and unresponsive interactions?
The main thread handles every UI update, touch event, and animation frame. A 14ms code execution block nearly fills the entire 60 FPS frame budget. That leaves almost no room for any synchronous work before frames start dropping.

Blocking the main thread causes simultaneous failures across tap response, animations, and scrolling. Users experience this as an app that feels frozen or unresponsive, even when the underlying logic is technically working. The perception of slowness is immediate and severe.
Common main thread offenders include:
Synchronous disk reads and writes during user interactions
JSON parsing on the UI thread after a network response
Heavy computation triggered by button taps or scroll events
Frequent object creation that triggers garbage collection pauses
Small synchronous disk I/O or network calls accumulate into ANR errors and full UI freezes. Android's ANR threshold is 5 seconds for input events. Most users abandon the app long before that threshold is reached.
Pro Tip: Profile your app with Android Studio's CPU Profiler or Xcode Instruments during real user interactions, not just on startup. The worst main thread violations almost always appear during scroll events and state transitions, not during launch.
Move all blocking work off the main thread. Use coroutines, async/await patterns, or background thread pools for disk I/O, network calls, and parsing. Return results to the main thread only when the UI needs to update.
Why do network latency and inefficient API calls slow down your app?
Network problems are the most misdiagnosed category of mobile app speed issues. Developers focus on individual endpoint response times, but the real culprit is usually request structure. Multiple sequential network requests increase perceived latency even when no single endpoint is slow. This "chatty app" pattern is one of the most common causes of slow loading screens.
Four network problems that kill app speed
Request waterfalls: Screen A waits for API call 1 to complete before firing API call 2. Each call adds its full round-trip time to the user's wait.
Oversized payloads: APIs returning full data objects when the screen only needs three fields waste bandwidth and parsing time.
Missing caching: Fetching the same data on every screen visit when the data changes infrequently adds unnecessary latency on every interaction.
Broken retry logic: Aggressive retry storms after a failed request flood the server and delay recovery, making a temporary outage feel permanent to the user.
Fix these problems in order of impact. Batch related requests where possible. Cache responses with appropriate TTL values based on how frequently the data changes. Use tools like Flipper or Charles Proxy for API response testing to identify which calls are blocking the critical path.
Geographical latency also matters more than most teams account for. A user in Southeast Asia hitting a server in Virginia adds 200–300ms of round-trip time to every uncached request. CDN placement and regional API endpoints solve this problem at the infrastructure level, not the code level.
How do rendering inefficiencies cause sluggish scrolling and frame drops?
Every frame your app renders goes through three passes: measure, layout, and draw. Deeply nested or large view hierarchies force the system to repeat expensive calculations across every node in the tree. A screen with 12 layers of nested containers costs far more to render than one with 4 layers, even if they look identical to the user.
List views are the most common rendering problem in production apps. Expensive item layouts, frequent full list rebinds, and unoptimized image loading combine to produce the stuttering scroll that users describe as the app "feeling cheap." The fix is not always a faster device. It's a flatter layout tree and smarter update logic.
Pro Tip: Update only the changed UI components, not the entire screen. In Android, use DiffUtil for RecyclerView to calculate minimal update sets. In iOS, use diffable data sources for UICollectionView. Both approaches cut rendering work by 60–80% on typical list screens.
Rendering problem | Symptom | Fix |
|---|---|---|
Deep view hierarchy | Slow layout pass, frame drops | Flatten to 4 layers or fewer |
Full list rebind | Scroll stutter | Use DiffUtil or diffable data sources |
Unoptimized images | Memory spikes, jank | Resize to display dimensions before loading |
Expensive draw calls | GPU overload on older devices | Reduce overdraw, simplify custom views |
Profile frame rendering times with Android GPU Profiler or Xcode's Core Animation instrument. Target consistent frame delivery under 16ms. Any frame that takes longer than 16ms drops below 60 FPS and registers as visible jank.
Key takeaways
Mobile app slowness is caused by distinct, diagnosable failures in startup, main thread usage, network structure, and rendering, and each requires a targeted fix rather than a broad refactor.
Point | Details |
|---|---|
Segment by lifecycle phase | Diagnose startup, interaction, rendering, and network issues separately for faster, more precise fixes. |
Enforce startup benchmarks | Cold and warm starts must stay under 2 seconds; hot starts under 1.5 seconds to avoid visible degradation. |
Protect the main thread | Keep all disk I/O, parsing, and computation off the UI thread to stay within the 14ms frame budget. |
Fix network structure first | Eliminate request waterfalls, add caching, and reduce payload size before tuning individual endpoints. |
Profile on real devices | Battery saver modes and background apps reveal slow paths that emulators consistently miss. |
The performance trap most developers walk straight into
I've reviewed dozens of apps where the team spent weeks parallelizing everything, convinced that more threads meant more speed. The results were almost always worse. Over-parallelization causes CPU contention and context switching that degrades performance below what well-managed sequential execution would have delivered. More threads is not the answer. The right threads doing the right work is.
The other trap I see constantly is testing only on emulators and flagship devices. Production device variability reveals slow paths that lab testing misses entirely. Battery saver mode, background apps, and variable network conditions expose architectural weaknesses that a clean emulator environment hides. Your app's real performance is what a mid-range device on a congested network delivers, not what a Pixel 9 on Wi-Fi shows in your office.
The most practical advice I can give you: fix startup first, then main thread violations, then network structure, then rendering. That order matches where user complaints concentrate. A 3-second cold start hurts more than occasional scroll jank. Prioritize by user impact, not by what's easiest to fix. And set up continuous performance monitoring before you ship the next release. A performance budget enforced in CI catches regressions before users do.
— Cyrus
How TouchZen builds apps that stay fast after launch
Performance problems compound when they're fixed reactively instead of built out from the start. TouchZen's senior developers work directly with your team from architecture decisions through post-launch monitoring, which means performance is a design constraint, not an afterthought.
TouchZen has launched over 75 apps across iOS and Android, with results that include 100k downloads in the first year. The team addresses startup speed, network architecture, and rendering efficiency as part of every build, not as a separate optimization pass. If your app has a speed problem you can't isolate, the mobile app development experts at TouchZen can diagnose it and fix it at the source. You can also review TouchZen's track record as a top-ranked app developer before starting the conversation.
FAQ
What is a good cold start time for a mobile app?
A cold start under 2 seconds is the industry benchmark for "instant" user perception. Exceeding this threshold causes visible performance degradation and can negatively affect app store rankings.
Why does my app feel slow even with fast internet?
Slow apps on fast connections usually suffer from request waterfalls, where multiple sequential API calls stack their latency, or from main thread blocking that prevents the UI from updating after data arrives.
What is the 14ms frame budget in mobile apps?
The 14ms frame budget is the maximum time available to complete all rendering work per frame at 60 FPS. Any synchronous task that exceeds this budget on the main thread causes dropped frames and visible jank.
How do I find what is slowing down my app?
Segment the problem by lifecycle phase: startup, interaction, rendering, and network. Use Android Studio CPU Profiler, Xcode Instruments, or developer productivity tooling to isolate which phase is failing before writing any fix code.
Does adding more threads make a mobile app faster?
Not always. Over-parallelization causes CPU contention and context switching that can make performance worse than sequential execution. Use background threads for blocking work, but avoid creating more threads than your CPU cores can handle efficiently.