Joy Foroughi
Executive Assistant


Is App Store Optimization Worth It? Costs, ROI, and Results
Discover if App Store Optimization is worth it. Explore costs, ROI, and results to enhance your app's visibility and downloads.

TL;DR:
App Store Optimization can deliver strong returns by increasing organic app discoverability and reducing reliance on paid acquisition. It costs between free and over $25,000 monthly depending on scope, with key expenses in tooling, creative assets, and labor. Effective ASO relies on continuous testing, strategic budgeting, and integration with paid campaigns for optimal growth.
App Store Optimization (ASO) is the strategic process of increasing an app's visibility and conversion rate in app stores to generate sustainable organic downloads and reduce acquisition costs. If you are a developer or marketing professional asking whether ASO is worth the investment, some well-executed ASO programs report 300–500% ROI on a typical monthly spend of $500–$3,000, although results can vary by app category, competition, and execution. That return comes from a simple fact: 65% of app downloads originate from store search, meaning organic discoverability is the single largest acquisition channel available to you. Apps with stronger metadata and creative assets can achieve significantly better visibility and conversion rates than unoptimized competitors. The question is not whether ASO works. The question is how much to invest and what to realistically expect.
What does App Store Optimization actually cost?
ASO costs range from $0 for a solo developer using free tools to more than $25,000 per month for a full-service agency managing a large app portfolio. The wide range reflects real differences in scope, team size, and creative production requirements. Understanding where your app falls on that spectrum is the first step toward building a realistic budget.
Core cost categories
The three primary cost buckets in any ASO program are tooling, creative production, and labor.
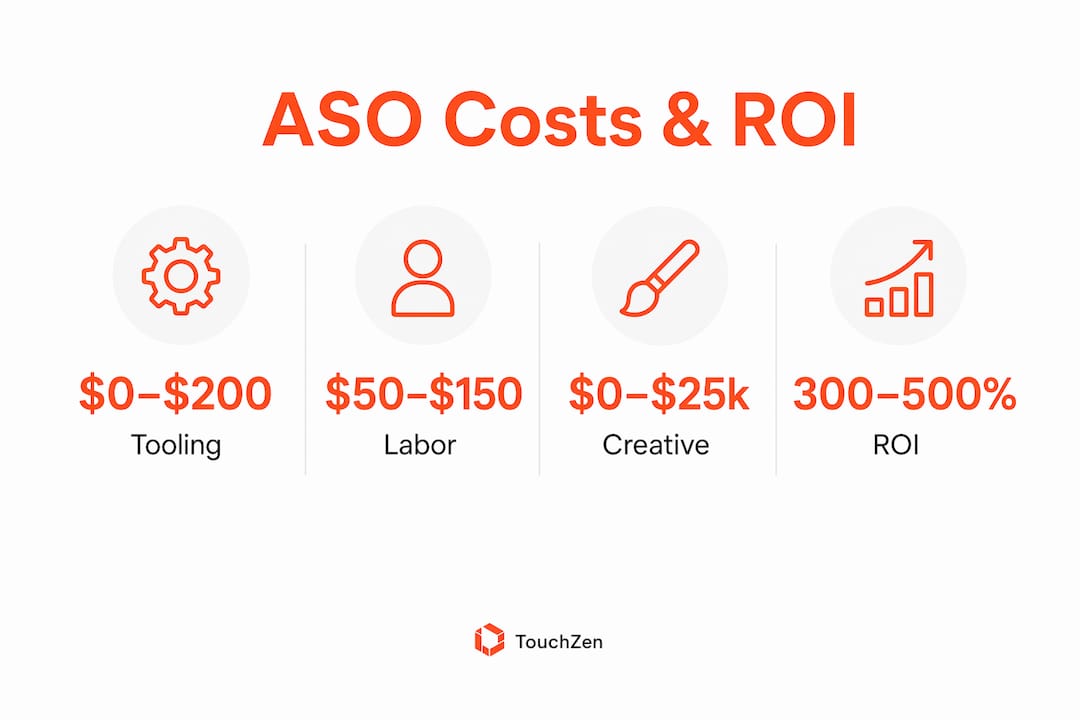
Tooling covers keyword research platforms, rank tracking, and A/B testing software. Entry-level plans from established ASO platforms run $50–$200 per month. Enterprise-grade subscriptions with competitive intelligence and multi-app management can reach $1,500 or more per month.

Creative production is where budgets diverge most sharply. A developer who designs their own screenshots pays nothing beyond time. A team that commissions a professional video preview from a studio can spend several thousand dollars per asset. Localization fees for full creative and metadata adaptation into a single language can reach $8,000, which adds up fast for apps targeting multiple markets.
Labor is the largest variable. Freelance ASO specialists typically charge $50–$150 per hour. Boutique agencies start around $1,500 per month and scale to $10,000 or more. An in-house ASO manager, when you factor in salary, benefits, taxes, and tooling, costs 1.25x to 1.4x their base salary, often exceeding $150,000 annually.
Cost Component | Solo Developer | Growth-Stage Team | Enterprise |
|---|---|---|---|
ASO tooling | $0–$200/mo | $200–$800/mo | $800–$1,500+/mo |
Creative production | $0–$500 one-time | $500–$3,000/project | $3,000–$10,000+/project |
Labor (freelance/agency) | $0–$500/mo | $1,500–$5,000/mo | $10,000–$25,000+/mo |
Localization | $0 | $500–$3,000/language | $3,000–$8,000/language |
Hidden costs catch most teams off guard. Internal time spent reviewing reports, briefing designers, and updating metadata is real overhead. Apps with high organic search visibility typically allocate about 20% of their total user acquisition budget to ASO. That ratio gives you a useful calibration point when setting your own budget.
What ROI can you expect from ASO, and how is it measured?
ASO return on investment is calculated using a straightforward formula: take the value of organic installs generated, subtract the ASO investment, then divide by the investment and multiply by 100. Some well-run ASO programs report ROI in the 300–500% range, although actual returns vary depending on the app’s category, monetization model, baseline traffic, and execution quality.
Key ROI drivers and benchmarks
ASO Activity | Measured Impact |
|---|---|
Keyword optimization | 27% increase in installs |
Full ASO stack (metadata + creative + CRO) | 130% YoY organic download growth |
Optimized title with primary keyword | Can improve install conversion when the keyword is relevant and naturally placed |
Organic vs. paid user retention at day 30 |
Retention quality is the factor most teams undervalue. Organic users retain 40–60% better at day 30 than paid users. That gap compounds over a user's lifetime, meaning the true lifetime value (LTV) of an organic install is substantially higher than a paid install at the same cost per install (CPI). When you plug higher LTV into the ROI formula, the returns from ASO grow even more favorable.
Pro Tip: Track impression-to-install rate alongside raw download numbers. A rising impression count with a flat install rate signals a creative or conversion problem, not a visibility problem. Fixing the right variable saves budget and accelerates results.
ROI variance across apps is real. A niche B2B utility with a small addressable market will see slower volume growth than a consumer app in a high-search category. Category competition, keyword difficulty, and the quality of your creative assets all influence where your results land within the 300–500% range.
How does ASO compare with paid user acquisition?
ASO and paid user acquisition (UA) are not competing strategies. They are complementary levers with different cost structures, timelines, and output quality. Understanding the tradeoffs helps you allocate budget more precisely.
Paid UA delivers installs within days of launching a campaign. You pay a cost per install that averages $3.12 on iOS in the US. That cost is ongoing. Every install requires another dollar. ASO can reduce the marginal cost of additional organic installs over time once the program is established. That asymmetry is why ASO produces compounding returns over time while paid UA costs remain linear.
ASO advantages:
Near-zero marginal CPI after initial investment
Higher user retention and LTV from organic installs
Builds lasting store authority that compounds over months
Reduces blended CPI when combined with paid campaigns
Paid UA advantages:
Immediate install volume on launch day
Precise audience targeting by demographic and behavior
Boosts ranking velocity, which amplifies ASO results
Controllable spend with predictable short-term output
The most effective growth programs use paid installs to boost ranking velocity and generate early reviews, which then amplify organic ASO performance. Paid UA is the accelerant; ASO is the engine. Running both together produces better outcomes than either approach alone. For a deeper look at combining these channels, the mobile app marketing strategies guide covers the mechanics in detail.
Pro Tip: Run a controlled paid UA campaign at launch to generate initial traffic, test conversion, and strengthen early ranking signals. Those signals feed the store algorithm and give your ASO program a stronger foundation to build on.
What practical outcomes should you expect from ASO?
Realistic expectations prevent wasted budget and misaligned team goals. ASO is not a one-time task. It is an iterative program that produces compounding results over a 4–12 week initial window, then continues improving with each optimization cycle.
The first cycle typically focuses on keyword research, metadata rewriting, and screenshot redesign. You can expect meaningful ranking movement within 4–6 weeks on lower-competition keywords. High-competition keywords take longer, often 8–12 weeks, and require sustained effort. Apps that commit to continuous creative testing and metadata updates consistently outperform those that treat ASO as a launch-and-forget task.
Key performance indicators (KPIs) to track from day one:
Keyword rankings: Monitor position changes for your 20–30 primary and secondary keywords weekly.
Impression-to-install rate: This is your conversion rate. A rate below category benchmarks signals a creative problem.
Organic install volume: Track week-over-week and month-over-month to identify trend direction.
Day-7 and day-30 retention: Long-term ASO success depends more on retention quality than raw download numbers.
Rating and review velocity: Store algorithms weight recent reviews heavily. Prompt satisfied users to rate the app.
One often-overlooked constraint is keyword density. Avoid keyword stuffing. Focus instead on natural, relevant keyword placement in the app title, subtitle, short description, and platform-specific keyword fields. Stuffing keywords into your description does not help. Precise placement in the title, subtitle, and keyword field does. For a practical walkthrough of these mechanics, the guide on optimizing for the App Store and Google Play covers the technical details clearly.
Diminishing returns are real for highly optimized apps. Once you rank in the top three positions for your core keywords, incremental ranking gains produce smaller volume increases. At that stage, conversion rate optimization (CRO) through creative testing becomes the primary growth lever.
What teams often misunderstand about ASO ROI
The biggest mistake I see teams make is treating ASO as a metadata project rather than a conversion program. They spend two weeks rewriting their description, update their keywords, and then wait for downloads to arrive. When results plateau after six weeks, they conclude ASO does not work. What actually happened is they skipped the half of ASO that drives conversions: creative asset testing.
Screenshots and preview videos are the first thing a user evaluates after finding your app in search. A well-optimized keyword strategy gets you in front of users. Weak creative sends them to a competitor. The conversion rate gains from screenshot redesign frequently outperform keyword changes in the first 90 days. Teams that test both in parallel see the compounding effect the statistics describe.
The in-house versus agency decision also deserves more careful analysis than most teams give it. An agency can be a practical option when a company needs specialized ASO expertise without building a full internal team. Beyond that threshold, an internal hire often delivers better results because they develop deep institutional knowledge of your app, your users, and your competitive set. The in-house vs. agency comparison framework applies directly to ASO staffing decisions, not just development.
The teams I have seen generate the strongest ASO ROI share one habit: they treat every metadata update and creative change as a hypothesis to test, not a conclusion. They run A/B tests, read the data, and iterate within two-week cycles. That discipline, more than any single tactic, is what separates 130% year-over-year growth from flat results.
— Cyrus
How TouchZen helps you build an ASO program that compounds
App Store Optimization produces its best results when it is built into the app from the start, not bolted on after launch. TouchZen works with developers and marketing teams to integrate ASO strategy into the product roadmap, from metadata architecture and keyword targeting to creative production and post-launch testing cycles.
Across its portfolio, TouchZen has supported app launches and growth initiatives that have produced outcomes such as 100,000 first-year downloads and significant subscription growth. That track record comes from treating ASO as an ongoing growth program, not a one-time checklist. If you are evaluating whether to build ASO in-house or partner with a team that has done it at scale, the mobile app development services page outlines how TouchZen structures that work. You can also review TouchZen's standing as one of the top-ranked app developers in the US before making a decision.
Key Takeaways
ASO delivers 300–500% ROI for most apps because organic installs carry near-zero marginal cost and retain 40–60% better than paid users at day 30.
Point | Details |
|---|---|
ASO ROI benchmark | A well-run program returns 300–500% ROI on a $500–$3,000 monthly investment. |
Organic install quality | Organic users retain 40–60% better at day 30, raising lifetime value above paid installs. |
Cost scales with scope | Solo developers can start near $0; enterprise programs exceed $25,000 per month. |
Paid UA and ASO work together | Paid installs boost ranking velocity and reviews, amplifying organic ASO results over time. |
CRO drives compounding gains | Testing creative assets alongside metadata produces stronger results than keyword changes alone. |
FAQ
What is App Store Optimization?
App Store Optimization (ASO) is the process of improving an app's metadata, creative assets, and conversion signals to rank higher in store search results and increase organic installs.
How long does ASO take to show results?
Most apps see meaningful ranking movement within 4–6 weeks on lower-competition keywords, with high-competition terms requiring 8–12 weeks of sustained effort.
Is ASO effective for small developers with limited budgets?
ASO is effective at any budget level. Solo developers can start with free tools and DIY creative, then scale investment as organic download volume grows and justifies higher spend.
How do I measure ASO return on investment?
Calculate ASO ROI using this formula: (Value of Organic Installs minus ASO Investment) divided by ASO Investment, multiplied by 100. Industry benchmarks place strong programs at 300–500%.
Should I hire an agency or build an in-house ASO team?
Agencies are cost-effective up to roughly $10,000 per month in fees. Beyond that threshold, an in-house hire typically delivers better results through deeper product knowledge and faster iteration cycles.